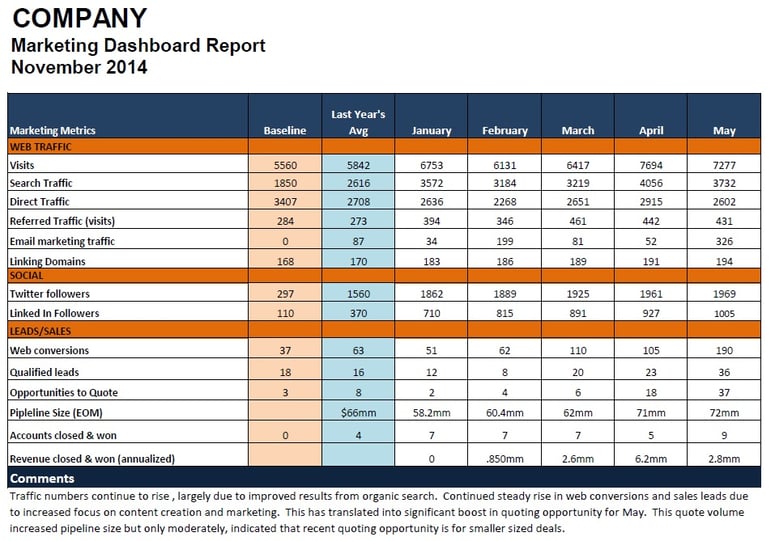
If you don’t have one, create a marketing dashboard for your company now.
Like today.
Certainly before the new year.
It’s the document you would share each month with your CEO, and your sales lead, to provide an objective assessment of what business results are being achieved from the company’s marketing investments.
It might looks something like this.

You can determine the exact format and metrics to track. But create it. Even if your CEO or boss haven’t asked for it.
Why do I bring this up? Because, as easy and as obvious as it may seem that logistics companies should be tracking the success of their marketing programs, many do not. Or they don’t do a great job at connecting marketing efforts with what really matters to the business – sales.
Benefits of a marketing dashboard include:
- Shows you are accountable
- Serves as a good “at-a-glance” review for busy executives and allows them to make the connection between marketing and sales activity
- Flags areas for attention, such as downward trends in leads or quoting opportunities
- Provides a great historical reference tool if it can be sustained over a period of years
- Allows you to overlay your calendar of activities with these metrics to determine which have had the most impact
I never start a client project without getting a baseline read on all the key metrics that matter. In the case of a poor or non-existent CRM system, I’ll ask the company to use manual methods to determine metrics like sales leads per month and sales quotes per month. It’s essential to have this baseline to determine whether your efforts are moving the needle.
Measurement should be fairly straightforward, with the possible exception of the sales data. Any good web analytics package, like the free Google Analytics, will give you your web data. Your social media stats can be grabbed from your social site. Metrics on sales activity would be in your CRM. Some marketing automation tools, like Hubspot, have all this data in one place.
At the very least, your marketing automation tool can integrate with your CRM to provide closed loop feedback on marketing campaigns. One metric I like, that is not in our example, is the percent of the sales pipeline that is made up of marketing-driven leads. The right “lead source” data in your CRM makes this an easy calculation.
One closing tip on creating a marketing dashboard: Add a comment within Excel for every metric you list detailing exactly how the baseline metric was determined. (Example: “Qualified leads” = all the leads that Sales classified as “qualified” within the Lead Status field of the CRM during the month) Try to stay true to that measurement method to ensure an apples-to-apples comparison. If the measurement method changes, note that in another comment in the month the change started.
Hey, we’re in logistics, an industry where we live and die by operational metrics and performance dashboards. We simply need to match the efforts of our operations colleagues in capturing the right data and making it accessible to executives in a clear, simple format.


